What actually gets recorded
For a dynamic QR code the measurement path is short and worth being literal about:
| Step | What happens | Is it observable by the QR platform? |
|---|---|---|
| Camera decodes the pattern | On the phone | No |
| Person taps the link | In the phone's UI | No |
| Short link is requested | At the redirect | Yes — this is the scan event |
| Browser follows to the destination | On the network | Only inferred |
| Destination page renders | On your website | No — that is website analytics |
Everything a QR dashboard knows comes from step three. So the responsible question is never “how many people scanned?” It is “how many requests were recorded, and what evidence arrived with them?”
Link previews, crawlers, and the traffic nobody scanned
Share a short link in a messaging app and the app may fetch it before any human opens it — to build a preview card, to check it for malware, to read its metadata, or to cache it. That fetch is a request at the redirect. The person may never open the destination at all.
Automated requests arrive from more sources than most dashboards admit:
- search and social crawlers;
- messaging link previews;
- corporate email and link scanners;
- security products;
- uptime and monitoring checks;
- your own QA scripts, and the sample scans you did while testing.
Some declare themselves plainly. Some declare nothing useful. That is precisely why “bot detection” is honest only when it is framed as a classification signal.
Counted by default, removable on purpose, never removed silently
The tempting product decision is to subtract recognised bots from the headline and present the remainder as your audience. It reads better. It is also the decision that manufactures confident, wrong numbers — because the filter’s coverage is unknown and the reader can no longer see what was removed.
So the default view is All events: automated activity is counted in every figure and named on the coverage card. When a spike is really one scanner sweeping your links, it looks like one scanner sweeping your links.
There is a filter — Traffic → Exclude classified automated — and it is worth being clear that this is not a reversal of the paragraph above. The objection was never to excluding automated requests. It was to excluding them invisibly, so that a reader sees a number without knowing what was taken out of it. The filter is a choice the reader makes, it is named on the control, and the automated count is taken before the filter runs, so the figure survives into the filtered view instead of collapsing to zero and erasing its own evidence.
| Reading | Total scans | Automated | If it had been filtered silently |
|---|---|---|---|
| Sister product, one day | 837 | 631 (75%), one scanner | “−87% versus the previous period” — a fall that was entirely one sweep |
| VastQR production, 22 Aug 2026 | 10 | 8 (80%) | “2 scans” — technically defensible, and a misleading picture of what the log contains |
The first reading is the whole argument. Quietly removing that scanner would have produced a plausible headline about a collapse in demand, and the collapse would have been an artefact of the filter.
How we tested: Two first-hand readings. The first is from a sister QR product operated by the same team, where a single day recorded 837 scans, of which 631 came from one self-identifying scanner making a sweep. The second is VastQR's own production scan log on 22 August 2026, read directly from the database after 747 synthetic seed rows were removed: 10 real scan events remained, of which 8 were the same automated client and 2 were an iPhone.
What this does not prove: Both are single observations, not a rate you can expect. The 80% figure below is what a product with no external traffic yet looks like — as real customer scans arrive, the ratio changes completely. Neither reading says anything about how accurately unidentified automated agents are classified, because by definition those are the ones nobody counted.
What each of the two views can be said to mean
| View | What it contains | What you may safely say about it |
|---|---|---|
| All events | Every recorded event in scope, recognised automated requests included | Raw redirect activity |
| Exclude classified automated | What remains after the events the classifier recognised are removed | A filtered operational view |
| Neither view | — | A verified count of people |
The last row is the one that matters, and it is the reason the filter did not get called anything friendlier. A request that is not classified as automated has not been shown to be human — it has only failed to match a pattern.
Reading the filter without overclaiming
The filter changes the event set. It does not change how much you know. Take the second production reading in the evidence above — VastQR’s own scan log on 22 August 2026, after the synthetic rows were removed:
All events                     10
Classified automated            8
Exclude classified automated    2
The defensible sentence is: two recorded events remain after excluding the eight the current classifier recognised as automated. The indefensible one is two people scanned — and in this particular case we happen to know it is wrong, because those two events were an iPhone belonging to the person running the test.
Four things keep that gap open no matter how large the numbers get:
- an unrecognised bot can still be sitting in the remainder;
- one person can produce several events;
- device and location metadata are context, not identity;
- the filter does no person-level deduplication, because there is nothing to deduplicate on.
“Unique scans” sounds precise and usually is not
Unique by what? Every available method has a different failure mode:
| Method | What breaks it |
|---|---|
| IP address | Mobile networks share IPs across many people; IPs also change mid-session |
| IP plus user agent | Two identical phones on the same office Wi-Fi collapse into one |
| Cookie | Requires the destination to set one, and survives only until it is cleared |
| Device fingerprint | Browsers actively restrict it, and it carries real privacy weight |
| Account identity | Only exists if the person signs in, which almost no QR scanner does |
Multiple people share one device. One person carries several. Unless a product defines and discloses its method, “unique people” is not a safe synonym for “unique scans” — so VastQR reports the metric it can defend and does not offer a unique-person number at all.
Missing context is a denominator problem, not a zero
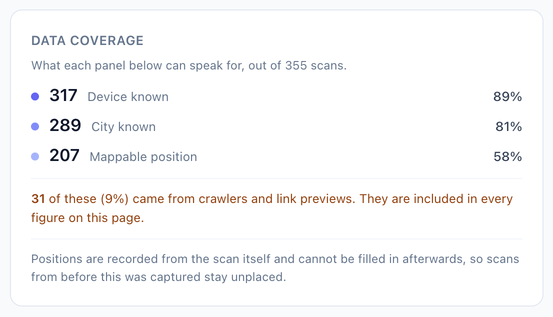
Suppose a city is known for 59 of 100 scan events. A careless chart draws the city breakdown as though it described all 100. The honest reading is: location data exists for 59% of recorded scans, and the chart describes that subset.
Missing location must not quietly become:
- a guessed city;
- the account owner’s own location;
- the coordinates
0,0; - an “unknown” bucket folded into a geographic percentage without explanation.
Device coverage has exactly the same problem, and it is a genuinely separate one: a request can carry a readable device and no city, or a city and no plottable position. Sharing one denominator across all three panels makes at least two of them wrong.
This is why the coverage panel exists. A map that silently invents a location for every unplaceable scan does not look broken. It looks like data.
How we tested: While writing tests for the scan-write path we found that an absent coordinate header was being parsed with Number(), which returns 0 for both null and an empty string. The check that followed only asked whether the result was finite. Every scan the edge could not place was therefore stored at latitude 0, longitude 0 — a point in the Gulf of Guinea — counted as a mappable position, and drawn on the map as a dot. Absence is now decided before parsing, and a test asserts that a genuine 0,0 and a missing value are told apart rather than each merely looking right on its own.
What this does not prove: This is one class of coverage error in one product on one date. It does not imply anything about how any other QR platform handles missing coordinates — but it is a concrete illustration of how a coverage gap turns into a confident false answer if nobody is watching for it.
Why redirect counts and GA4 sessions disagree
QR analytics observe the handoff; GA4 observes the website after it loads. Perfect equality is not the goal and would in fact be suspicious.
| Event | QR redirect | GA4 |
|---|---|---|
| Person scans and the page loads | Yes | Likely yes |
| Person opens, then closes immediately | Yes | Often no |
| Crawler requests the short link | Yes, labelled where recognised | Usually no |
| GA4 blocked by consent or an ad blocker | Yes | Often no |
| Visitor refreshes the landing page | No new request | More GA4 activity |
Words worth being careful with
Say this
- scan events, or recorded scans
- recognised automated traffic
- device coverage, location coverage
- approximate, network-derived location
- website sessions, for GA4
Not this, unless you can prove it
- people
- verified humans
- exact location
- 100% bot-free
- unique visitors
This is not pedantry about wording. Language is where an analytics product either preserves or destroys the reader’s ability to judge a number.
How to investigate a suspicious spike
One code jumps from 10 scans a day to 500. Before celebrating or deleting anything:
Six checks, in order
- Did the automated share rise?Compare All events with Exclude classified automated. If most of the spike disappears, you have learned the shape of the traffic — not that the remainder were people.
- What is the timing shape?Machines arrive in tight bursts. People arrive spread across opening hours.
- Did coverage change?A sudden drop in known devices or cities often means the new traffic is not phones.
- Did GA4 move too?Real visits usually show up on the website. Redirect-only movement suggests requests that never became visits.
- Was the link shared digitally?A short link posted publicly attracts previews and crawlers that a printed code never would.
- What changed in the business?A campaign launch, an event, a post, or a placement being moved. Check this before assuming a defect.
Making decisions with imperfect data anyway
None of this means QR analytics are unusable. It means they are good at relative comparison and poor at absolute headcount — which is fine, because almost every real decision is a comparison.
- Poster A against Poster B.
- Location A against Location B.
- Week one against week two.
- Table cards against window signs.
- This batch against the previous batch.
Consistent measurement stays directionally useful even when it is imperfect, provided everyone reading it knows the event definition, the coverage basis, and whether automated activity is in the total. A dashboard that can say we do not know is more valuable than one that cannot — because it teaches the reader which numbers deserve confidence.
Analytics that show you the denominator
Per-code scan attribution, device and location context with their own coverage figures, and recognised automated traffic counted and named by default — with a filtered view you choose rather than one applied on your behalf.