Analytics
QR Code Tracking for Dynamic QR Codes
See which printed QR codes are actually being scanned — by code, over time, by device, and by available location. Classified automated traffic is counted by default and reported as its own figure, and you can set it aside deliberately when you want the second view. Either way the number on the dashboard is one you can reason about rather than one you have to trust.
$19/month · up to 500 active dynamic QR codes · scan analytics included
How QR code tracking works
A QR code has no counter inside it. A static code sends the scanner straight to whatever URL is encoded in the pattern, so unless the destination is doing its own measuring, nothing records that a scan happened.
A dynamic code works differently. The printed pattern points at a short redirect. When that link is opened, the redirect service records the request before forwarding the visitor to the current destination. That single indirection is what makes a printed code measurable — and, separately, what makes it editable after printing.
What you can actually see
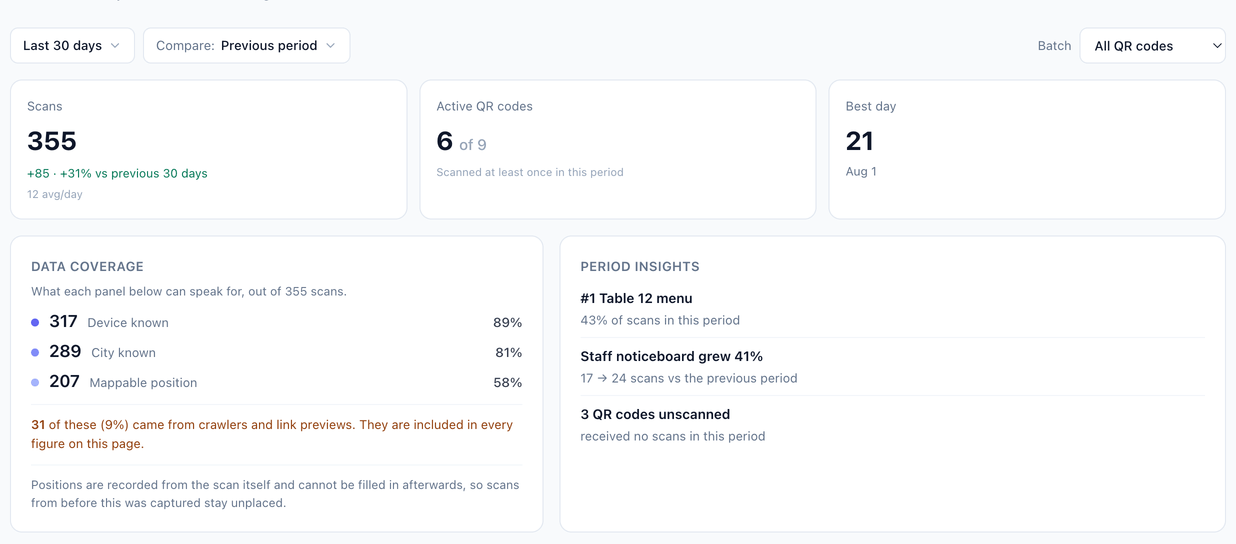
Scan totals and trend
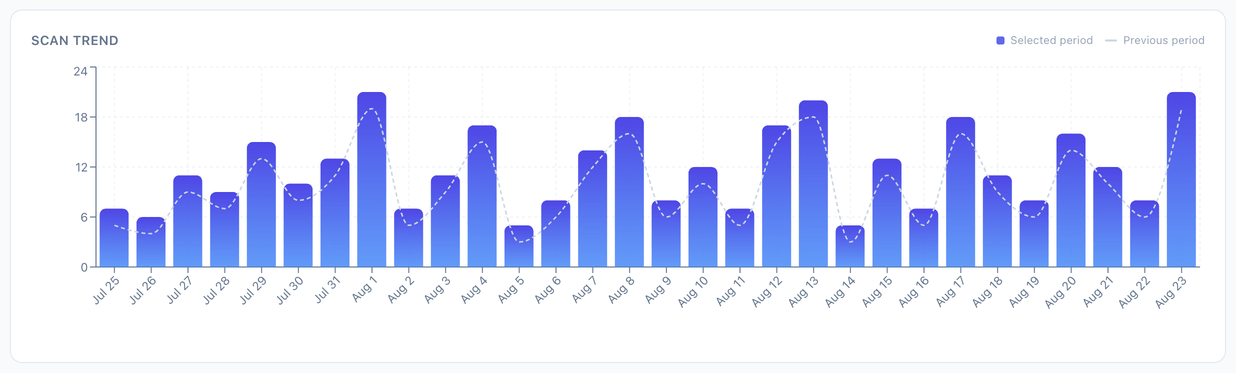
How many scan requests your codes received over the last 7, 30 or 90 days, compared against the previous period of the same length. Enough to answer whether a print run got used, which day peaked, whether activity rose after a placement went live, and whether an asset is still pulling traffic months later.
Why that distinction changes how you read every QR report →
Performance by QR code
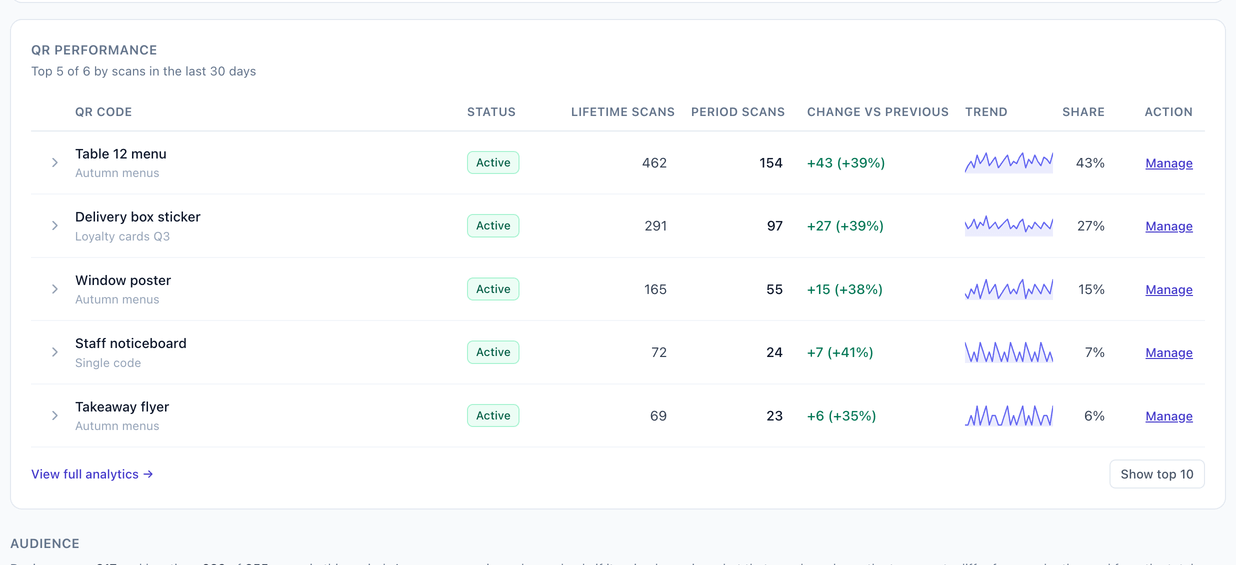
Once there is more than one printed placement, the useful question stops being how many scans did we get and becomes which code produced them. Every code carries its own lifetime total, its total for the period, its change against the previous period and its share of the batch — so a table tent, a window decal, a package insert and a flyer can be judged separately.
Device and location context, with their own denominators
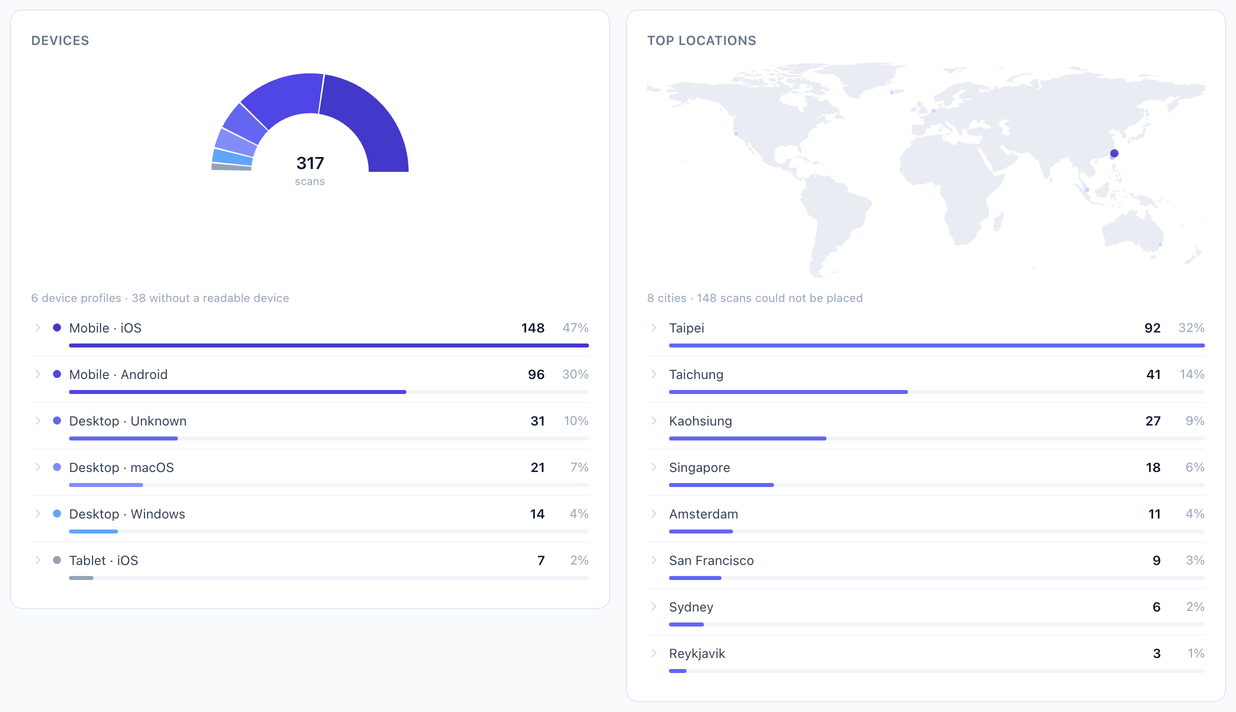
Where a request carried enough information, VastQR summarises the device type and OS family behind it, and the city it appeared to come from. Crucially, each panel reports how many scans it can speak for.
If device information exists for 89% of scans, the honest reading is not “89% of scanners used this device” — it is “device information exists for 89% of recorded scans, and here is what those look like.” The three coverage figures are independent: one scan can carry a device and no city, or a city and no plottable position. Sharing a single denominator across all three panels would make at least two of them wrong.
Automated traffic is counted by default, and can be set aside on purpose
Not every request to a redirect is a person with a phone. Link previews, crawlers, security scanners, uptime checks and your own testing all produce requests.
The default view is All events. Recognised automated activity is counted in every figure and reported as its own row on the coverage card, so a spike that is really one crawler sweeping your links looks like what it is rather than like demand.
When you want the operational view instead, switch Traffic to Exclude classified automated. The filter runs on the server before anything is calculated, so the trend, the per-code table, the comparison against the previous period, devices and locations all describe the same filtered set — they cannot disagree with each other. The automated count itself is taken before the filter runs, which is why it still appears in the excluded view: taken afterwards it would always read zero and remove the one number that makes the rest interpretable.
| View | What it contains | What it means |
|---|---|---|
| All events | Every recorded event in the selected scope | Raw operational activity, recognised automated requests included |
| Exclude classified automated | Those events minus the ones the classifier recognises as automated | A filtered operational view — not a verified-person count |
A scan count is not a person count
This is the single most misread number in QR analytics, so it is worth being explicit about what each question can and cannot be answered with.
| Question | What VastQR can tell you |
|---|---|
| How much activity did this code receive? | Scan-event totals and the trend across the period |
| Which codes generated it? | Per-code attribution, summing exactly to the period total |
| What context arrived with those scans? | Device type and OS family, city and mappable position, each with its own coverage figure |
| How much was automated? | The count and share of recognised crawlers and link previews, reported in either view |
| Who scanned it? | Nothing. A scan event is not an identity, and VastQR does not present it as one. |
Turning printed placements into something measurable
The value of QR tracking is not the chart. It is being able to compare physical placements that are otherwise almost impossible to measure.
Take a 200-piece campaign: 50 table tents, 40 counter cards, 30 window decals, 50 flyers and 30 package inserts. Point them all at the same URL with the same untracked code and the traffic is a single undifferentiated number. Give each placement its own dynamic code — still pointing at the same destination — and you can see which placements earn their print cost, then keep, move, reprint, pause or repoint accordingly.
That is where bulk creation, editable destinations and per-code analytics stop being three features and become one workflow.
Want to know which printed code gets scanned?
Paste or upload your destinations, validate the rows, and preview the whole batch before you pay for anything.
Static and dynamic tracking are not the same measurement
| Capability | Static QR | Dynamic QR in VastQR |
|---|---|---|
| Destination editable after printing | Usually no | Yes |
| Redirect-level scan recording | No | Yes |
| Scan count for one specific printed code | No | Yes |
| Trend against a previous period | No | Yes, over 7, 30 or 90 days |
| Device type and OS family, where available | No | Yes |
| City and map position, where available | No | Yes |
| Automated-traffic classification | No | Yes |
| Optional exclusion of classified automated events | No | Yes |
| Measurable with website analytics on the destination | Yes | Yes |
The last row matters, and most comparisons get it wrong. A static code pointing at a page you control can be measured — by that page’s own analytics, using a tagged URL. What it cannot do is attribute a visit to one specific printed asset at the redirect, which is the thing per-code tracking exists for.
QR analytics and website analytics answer different questions
A QR dashboard measures the handoff. GA4 measures the visit. Used together they cover the offline-to-online journey; used interchangeably they produce arguments about which number is “right.”
| Use it for | VastQR scan analytics | Website analytics such as GA4 |
|---|---|---|
| Scan volume on a printed asset | Yes | No |
| Attribution to one specific code | Yes | Only via tagged destination URLs |
| On-site engagement and page paths | No | Yes |
| Conversions and revenue | No | Yes |
| Requests where the page never loaded | Yes | No |
VastQR has no native GA4 integration. The way the two systems connect is a campaign-tagged destination URL, which GA4 reads when the page loads.
What VastQR records, and what it will not claim
Implemented today
- scan-event totals and daily trend
- comparison against the previous period
- per-code attribution, summing to the total
- device type and OS family where available
- city and mappable position where available
- independent coverage figures for each panel
- recognised automated traffic, counted and reported
- an All events / Exclude classified automated view
- 7, 30 and 90-day ranges
- filtering the whole view to one batch
Not claimed
- unique people or verified humans
- precise GPS or personal identity
- demographics
- purchase or conversion attribution
- perfect bot filtering
- browser-level analytics
- a native GA4 integration
- guaranteed complete location coverage
- guaranteed real-time delivery
Scan analytics for up to 500 active dynamic QR codes
VastQR Bulk — $19/month includes up to 500 active dynamic QR codes, bulk CSV creation, destinations you can edit after printing, scan analytics, batch management, the supported design controls, and PNG, SVG and PDF downloads. Billing is month to month.
There is no per-scan charge on the current $19 plan.
Know which printed QR codes are actually being used
Prepare a batch, validate the destinations, preview the design, and activate trackable dynamic codes when you are ready to deploy them. Preview the batch before you pay — $19/month for up to 500 active codes.